DOWNLOAD PDF HERE
ABOUT NESTLÉ
Nestlé—a major nutrition, health and wellness company—seeks to enhance the quality of life and contribute to a healthier future. Our ambition for the planet is to strive for zero environmental impact in our operations, which guides our work toward achieving our 2020 commitments and supporting the United Nations Sustainable Development Goals.
WHY IS NESTLÉ MEASURING FOOD LOSS AND WASTE?
Nestlé is committed to further playing its part in helping to reduce food loss and waste. This helps the company secure supplies of agricultural raw materials it requires, as well as having a positive impact on society by supporting rural development, water conservation, and food security.
WHAT HAS BEEN YOUR EXPERIENCE WITH USING THE FLW STANDARD?
In 2014, to further understand and reduce the waste occurring in our value chain, we initiated a milk loss and waste mapping exercise in Pakistan, applying the draft Food Loss and Waste Accounting and Reporting Standard.
We are now using the FLW Standard to target reductions and monitor progress in 30 countries where we buy fresh milk. It has been easy to use.
We have also used the FLW Value Calculator to estimate the environmental and nutritional benefits associated with our reduction of milk losses from 2017 to 2018.
WHAT CHALLENGES IN MEASURING FOOD LOSS AND WASTE HAVE YOU ENCOUNTERED AND HOW DID YOU OVERCOME THEM?
Since 2017 we have been consolidating data collected on losses in our dairy supply chain in 30 different countries. While we are taking a whole chain approach to minimizing losses, in this case study we focused on analyzing only the losses that take place during transportation to our factories, and when milk is rejected based on our quality tests at the factory gate. This stage is where we have some control and a suite of best practices to recommend to our supplier partners.
In 2017, we found that losses between farm gate and our factory were on average 0.33 percent of milk purchased, and ranged between 0.0 percent and 4.3 percent. In 2018, the losses were reduced to 0.20 percent on average, and ranged between 0.0 percent and 3.4 percent. While the percentage of loss is low between farm gate and factory gate, across 30 countries this represents over 10,000 tonnes of milk loss.
Our main challenge in measuring these losses is that we do not track at a corporate level the final destination of (a) the milk lost in transit to our factories, or (b) the milk rejected at Nestlé’s factories due to quality reasons. In some cases it may be used as animal feed. Future work will focus on better mapping the destinations of milk lost. We also intend to expand our scope and identify other instances—such as feed storage—where food loss occurs at the farm level.
Another challenge is that in some cases, the difference accounted as milk loss could be explained by better calibration of the scales used for weighing the milk purchased at the farm gate and received at the factory. Monitoring the correct operation of our scales is an important part of how we improve quality in the supply chain. It also is difficult to differentiate precisely whether a reduction in losses is due to improvements in the data collected or to actual physical losses during transportation and transfer.
WHAT ACTION HAS NESTLÉ TAKEN AS A RESULT OF MEASURING ITS FOOD LOSS AND WASTE?
As a major global dairy company, we have made a long-term commitment to reduce losses throughout the supply chain. Nestlé supports the dairy farming communities that produce our milk in several ways. This includes providing technical assistance on practices that help reduce wastage of resources at the farm level and improve yields. After several years of trials, Nestlé— together with Lely—in 2018 published a handbook applying the experiences from lean manufacturing systems to the dairy farming world. This handbook emphasizes reducing “waste” in all areas on the farm.
We support the reduction of losses along the supply chain by ensuring efficient delivery of raw materials to our factories and a precise capturing of volumes and possible losses at different stages in the supply chain. We have applied different measures to reduce milk losses, including (a) decreasing spillage, (b) improving discipline in milk handling, weighing, and digitally recording losses, and (c) applying a very strict cut-off time between milking, chilling, and processing in order to reduce the likelihood of milk spoilage.
WHAT ARE THE ENVIRONMENTAL, NUTRITIONAL, AND ECONOMIC IMPACTS FROM REDUCING LOSSES?
As noted, while the percentage of loss is low between farm gate and factory gate, based on the amount of milk lost across 30 countries, we found that in 2017 the GHG emissions associated with the milk lost at this stage were equivalent to 65,000 tonnes of CO2 -eq. In 2018, based on the reduction in losses, GHG emissions were reduced to 38,000 tonnes of CO2-eq. By reducing milk losses, we therefore estimate avoiding the emission of 27,000 tonnes CO2-eq, the equivalent of 2,470 trips around the world in a small car.[1]
Using the FLW Value Calculator, we were also able to estimate the nutritional impacts. By reducing milk losses, we avoided the loss of 559 tonnes of protein, the equivalent of protein requirements for one day for 11.2 million people, or for 30,634 people in a year.[2]
From an economic perspective, after subtracting the cost of undertaking these studies, the reductions from 2017 to 2018 provided farmers and Nestlé combined a net savings of approximately US$2.6 million.
WHAT IS INCLUDED IN THE SCOPE OF THIS FLW INVENTORY?
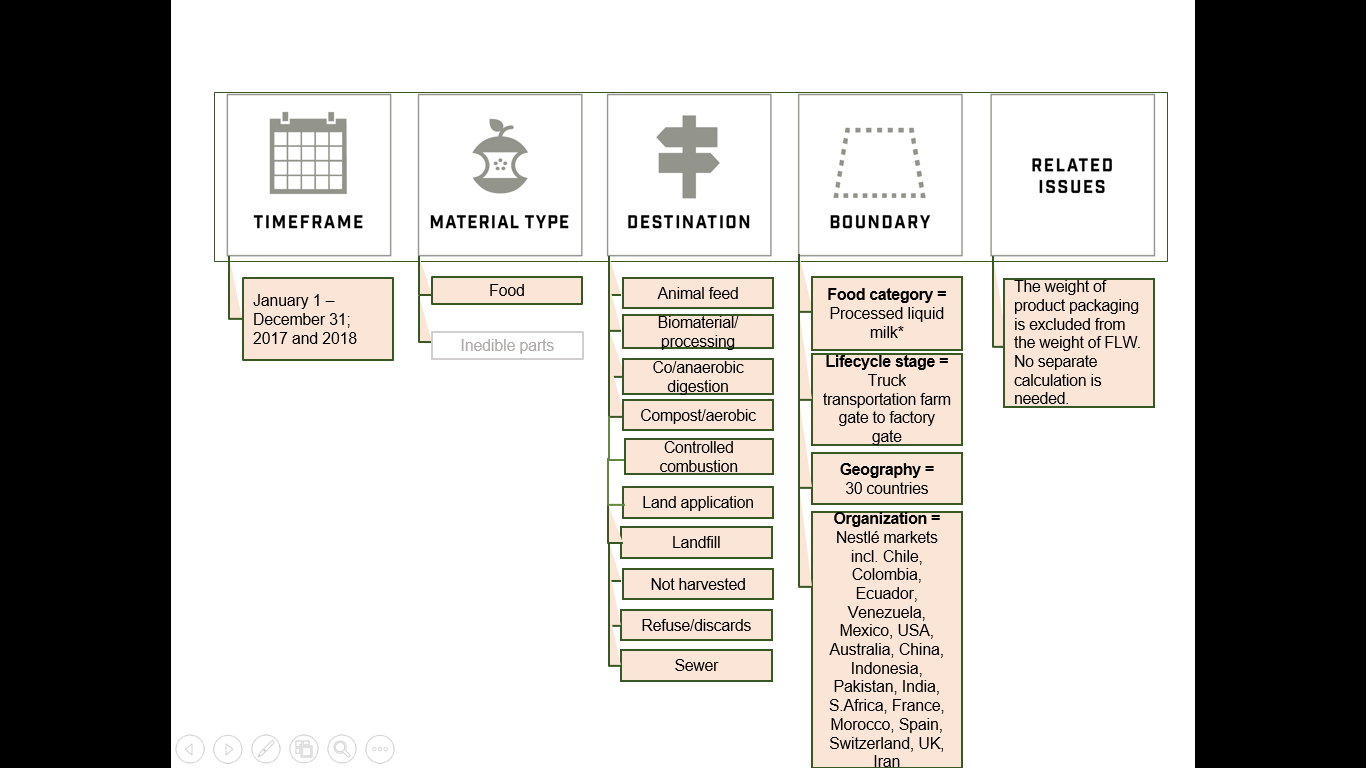
The following figure visually represents the scope of Nestlé’s food waste inventory for milk losses between the farm gate and its factories using the FLW Standard.
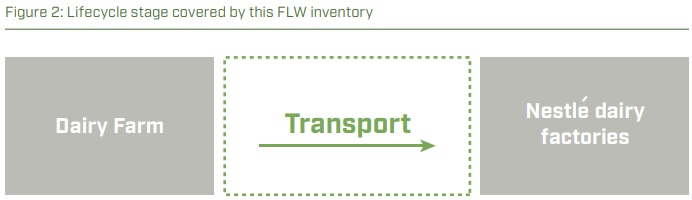
The following visual elaborates on the lifecycle stage that this inventory covers. The stage where milk is transported between the dairy farm and Nestlé’s dairy factories is in scope, which includes milk rejected on receipt in the factories.
HOW DOES THIS INVENTORY MEET THE FLW STANDARD‘S REQUIREMENTS?
The table below provides a summary of how this FLW inventory meets the eight reporting and accounting requirements contained in the FLW Standard.
| FLW STANDARD REQUIREMENTS & DESCRIPTION OF Nestlé’s FLW INVENTORY
(see www.FLWProtocol.org for details and guidance) |
| 1. Base FLW accounting and reporting on the principles of relevance, completeness, consistency, transparency, and accuracy
· Relevance: A section of the value chain was evaluated — from farm gate to the factory · Completeness: 30 fresh milk markets were included · Consistency: The same method was used in all markets to weigh milk purchased versus received at the factory gate · Transparency: The amount of losses by destination has not been calculated as we don’t have that level of dissagregation yet · Accuracy: Varies largely depending on the type of weighing instrument used, its tolerance, and how it is calibrated |
| 2. Account for and report the physical amount of FLW expressed as weight
Food waste reported in tonnes (and also tonnes GHG emissions and tonnes of protein losses avoided from 2017 to 2018) |
| 3. Define and report on the scope of the FLW inventory. (FLW Standard includes additional details)
Timeframe: Data reported for 2017 and 2018; January 1–December 31
Material type: Food. (No inedible parts were included because this study focused on dairy products that do not have inedible parts, e.g., fresh milk.)
Destinations: All possible types of destinations were considered in scope for the inventory. There is insufficient visibility on the destinations to provide additional detail.
Boundary: § Food category: Processed liquid milk [Central Product Classification Version 2.1 (CPC2.1), Group 22110] o Lifecycle stage: Transport from farm to factory o Geography: 30 countries, including Chile, Colombia, Ecuador, Venezuela, Mexico, USA, Australia, China, Indonesia, Pakistan, India, South Africa, France, Morocco, Spain, Switzerland, and the UK o Organization: Nestlé’s supply chain in 30 markets.
Related issues: Weight of packaging is excluded. No calculation was needed to separate packaging weight from food loss and waste, since the measurement refers to fresh milk in bulk.
|
| 4. Describe the quantification method(s) used. If existing studies or data are used, identify the source and scope
Milk purchased at farm gate and milk received at factory gate is weighed directly with the difference between the two amounts considered as our loss. |
| 5. If sampling and scaling of data are undertaken, describe the approach and calculation used, as well as the period of time over which sample data are collected (including starting and ending dates)
Not applicable |
| 6. Provide a qualitative description and/or quantitative assessment of the uncertainty around FLW inventory results
Uncertainty: 9 (accurate data provided by Nestlé) Qualitative estimate based on a scale of 1–10, with 10 signifying very accurate data
|
| 7. If assurance of the FLW inventory is undertaken (which may include peer review, verification, validation, quality assurance, quality control, and audit), create an assurance statement
Not applicable |
| 8. If tracking the amount of FLW and/or setting an FLW reduction target, select a base year, identify the scope of the target, and recalculate the base year FLW inventory when necessary
Not applicable |
ABOUT THIS CASE STUDY
This case study is part of a series that shows how companies and others are using the FLW Standard to measure and reduce food loss and waste. Find more case studies online at www.FLWProtocol.org.
ABOUT THE FLW STANDARD
The Food Loss and Waste Accounting and Reporting Standard (or FLW Standard) helps companies, countries, cities and others quantify “food loss and waste”—what to measure and how to measure it—and encourages consistency and transparency in the reported data.
A summary of definitions and requirements of the FLW Standard can be found online along with related tools to help users report the scope of their inventory and select a method for quantification.
ABOUT THE AUTHORS
This case study was submitted by Javiera Charad, Robert Erhard, and Namy Espinoza Orias (Nestlé), with input and review by Esben Larsen and Kai Robertson (representatives of WRI), as well as FLW Protocol Steering Committee representative Claire Kneller (WRAP).
ABOUT THE FOOD LOSS AND WASTE PROTOCOL
The Food Loss & Waste Protocol (FLW Protocol)—a multistakeholder partnership— has developed the global Food Loss and Waste Accounting and Reporting Standard for quantifying food and/or associated inedible parts removed from the food supply chain—commonly referred to as “food loss and waste” (FLW). World Resources Institute (WRI) serves as the FLW Protocol’s secretariat.
For questions, please contact flwprotocol@wri.org.
Published: July 2019
[1] The GHG emissions associated with transportation by a small car, operated with petrol, class Euro 5, are 0.278 kg CO2-eq per km. Source: ecoinvent v.3.3 database; impact assessment method: IPCC 2013, 100 years. Swiss Centre for Life Cycle Inventories (SCLCI) (2016). ecoinvent Database v. 3.3 Dübendorf, Switzerland. (www.ecoinvent.org)). A trip around the globe equals 40,000 km.
[2] The average protein content in the milk is taken as 3.4 g per 100 g. Nutritional requirements for protein are 50 g per day. Source: United States Department of Agriculture and United States Department of Health and Human Services. Dietary guidelines for Americans. 2015–2020. Accessible at: <https://www.dietaryguidelines.gov/current-dietary-guidelines>.
Photo Credit: la fattina/Flickr.